
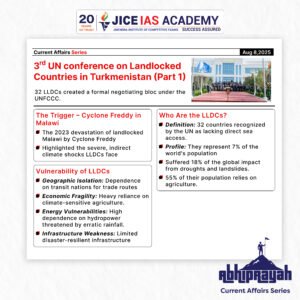
3rd UN conference on landlocked countries
UPSC CURRENT AFFAIRS – 08th August 2025 Home / 3rd UN conference on landlocked countries Why in News? At the
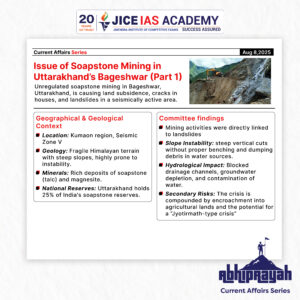
Issue of soapstone mining in Uttarakhand’s Bageshwar
UPSC CURRENT AFFAIRS – 08th August 2025 Home / Issue of soapstone mining in Uttarakhand’s Bageshwar Why in News? Unregulated
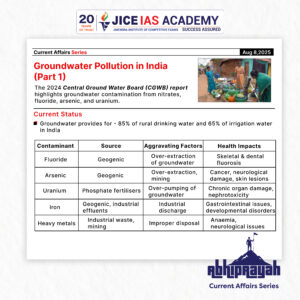
Groundwater Pollution in India – A Silent Public Health Emergency
UPSC CURRENT AFFAIRS – 08th August 2025 Home / Groundwater Pollution in India – A Silent Public Health Emergency Why
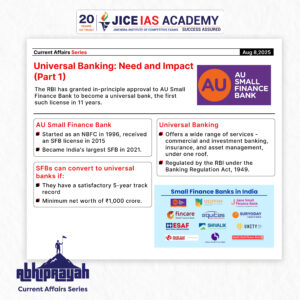
Universal banking- need and impact
UPSC CURRENT AFFAIRS – 08th August 2025 Home / Universal banking- need and impact Why in News? The Reserve Bank
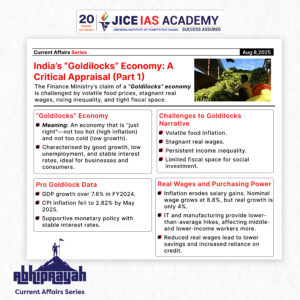
India’s “Goldilocks” Economy: A Critical Appraisal
UPSC CURRENT AFFAIRS – 08th August 2025 Home / India’s “Goldilocks” Economy: A Critical Appraisal Why in News? The Finance

U.S.-India Trade Dispute: Trump’s 50% Tariffs and India’s Oil Imports from Russia
UPSC CURRENT AFFAIRS – 07th August 2025 Home / U.S.-India Trade Dispute: Trump’s 50% Tariffs and India’s Oil Imports from
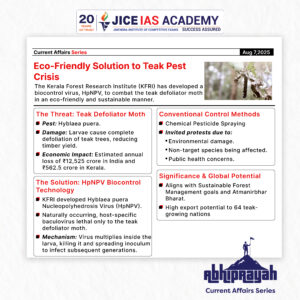
Eco-Friendly Solution to Teak Pest Crisis: KFRI’s HpNPV Technology
UPSC CURRENT AFFAIRS – 07th August 2025 Home / Eco-Friendly Solution to Teak Pest Crisis: KFRI’s HpNPV Technology Why in
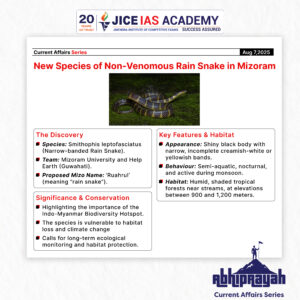
New Species of Non-Venomous Rain Snake Discovered in Mizoram
UPSC CURRENT AFFAIRS – 07th August 2025 Home / New Species of Non-Venomous Rain Snake Discovered in Mizoram Why in